11.3 trillion tonnes later, the ocean is 3.14 cm higher
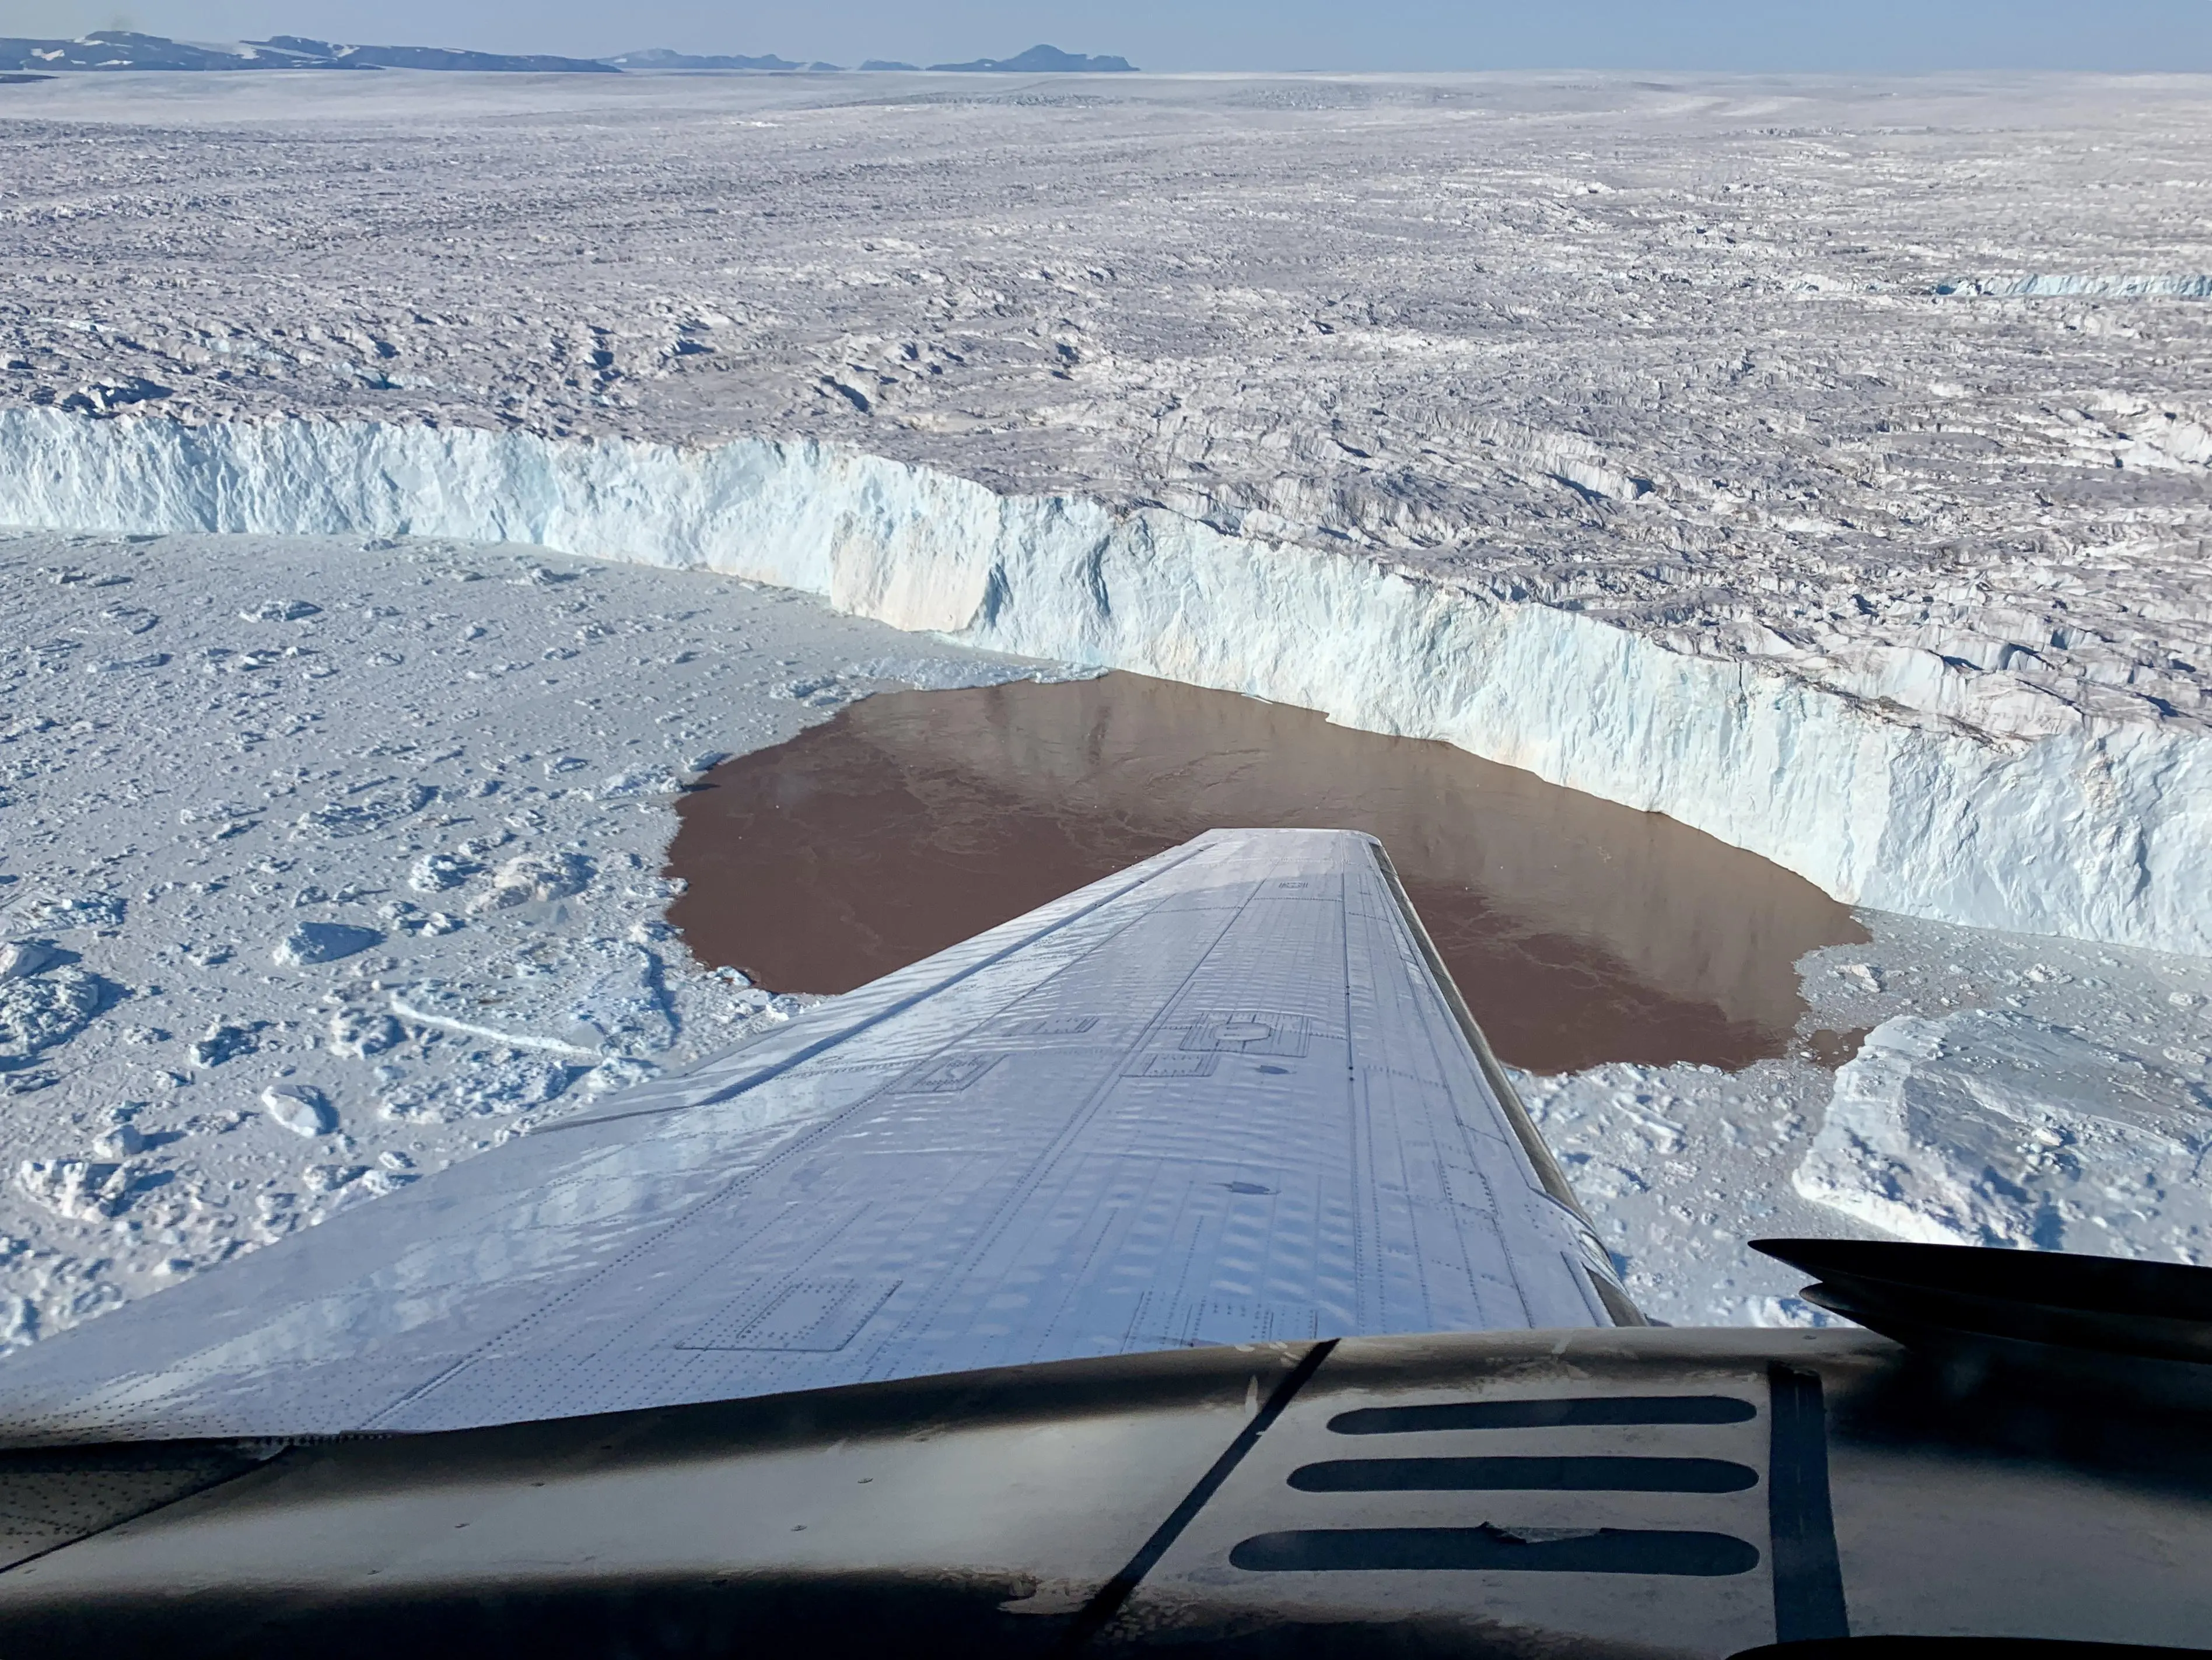
Imagine marking a dock piling in the late 1970s, then checking it again today. The ocean sits a little higher—not by a storm surge, but by the quiet arithmetic of ice leaving land. The longest satellite record yet assembled says Greenland and Antarctica together have shed more than 11 trillion tonnes of ice since the 1970s, nudging global sea level up by over three centimetres.
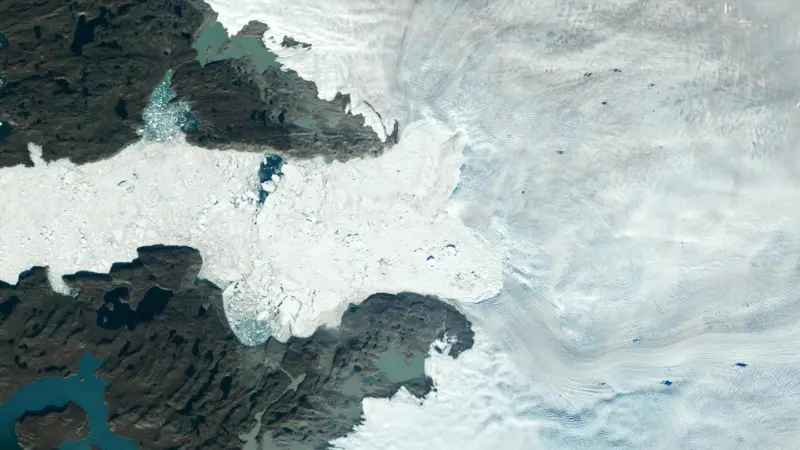
More than a single season’s melt is at work. The ice sheets’ draining glaciers have sped up, sluicing ice to the ocean. Taken together, Greenland and Antarctica now account for around a quarter of the world’s sea-level rise.
What the satellites add up to
Between 1979 and 2023, the tally is stark: 11.3 trillion tonnes gone, and 3.14 centimetres added to the ocean. Greenland’s share of that sea-level rise is 1.81 cm; Antarctica’s is 1.33 cm. Those numbers make the “more than three centimetres” concrete and show which pole has led the rise so far.
Crucially, ice loss is not just about sun-warmed surfaces. According to the latest results reported via ESA, 84% of the combined loss came from faster glacier flow that discharged ice directly into the sea. Only 16% came from surface melting across the ice sheets.
| Quantity | Greenland | Antarctica | Combined |
|---|---|---|---|
| Sea-level rise contribution (cm), 1979–2023 | 1.81 | 1.33 | 3.14 |
| Total ice lost, 1979–2023 (trillion tonnes) | — | — | 11.3 |
| Share of loss from faster-flowing glaciers (%) | — | — | 84 |
| Share of loss from surface melt (%) | — | — | 16 |
| Annual ice loss in the 1980s (billion tonnes/yr) | around 60 | around 48 | — |
| Annual ice loss in the 2010s (billion tonnes/yr) | 264 | 202 | — |
| Share of today’s global sea-level rise attributed to Greenland+Antarctica | — | — | around a quarter |
| Increase in high-end sea-level rise estimates by 2150 when ice-sheet instability is included | — | — | factor of 2.6 |
Acceleration is the headline
Ice losses sped up from the 1980s to the 2010s. Greenland’s annual losses climbed from around 60 billion tonnes to 264 billion tonnes per year; Antarctica’s rose from around 48 to 202 billion tonnes per year. The acceleration mirrors the finding that dynamic discharge—not just surface melt—dominates the mass budget.
That dynamic share matters. If most loss comes through faster flow, the levers that control glacier speed—ocean and ice interactions at outlet glaciers—loom large in projections. It also means rapid changes can occur without extreme summers at the surface.
A quarter of the rise gives the scale
“Around a quarter” of current global sea-level rise is a lot for just two regions on Earth. It puts the polar ice sheets on the same stage as thermal expansion and other contributors. To change that fraction, you would have to either slow the ice discharge or shrink other contributors—neither is simple.
Looking ahead, when researchers include the risk of ice-sheet instability, high-end sea-level rise projections by 2150 increase by a factor of 2.6. That multiplier is a warning label, not a certainty, but it explains why sustained monitoring is treated as essential.
What the record can’t settle yet
Recent years saw a slowdown in overall losses, but scientists describe it as a short-term variation, not a reversal. The ice sheets remain in net loss. Year-to-year weather can hide or heighten the trend for a while; it doesn’t rewrite the half-century trajectory.
No one has yet pinned down, from this record alone, how much each outlet glacier will contribute in the future or exactly when thresholds might tip. That’s why the continuous, multi-decade view is framed as vital to anticipating risks to the hundreds of millions living in low-lying coastal areas.
The deeper cut
Dynamic discharge beats melt: why 84% is plausible
If 84% of mass loss is through accelerated discharge, the control volume is the grounding-line-to-ocean conveyor. Speed-up increases flux roughly with thickness × velocity × width at gateways; even modest velocity increases at major outlets can outweigh large areas of modest surface melt inland. Surface mass balance anomalies integrate over vast plateaus but are seasonally noisy; discharge responds to buttressing loss and ocean-driven undercutting. That arithmetic makes a discharge-dominant budget unsurprising over multi-decadal periods. The acceleration from the 1980s to the 2010s is consistent with a shift from near-balance to persistent negative mass balance as discharge terms grew. For projections, the 2.6× inflation of high-end sea-level rise when accounting for ice-sheet instability encodes sensitivity to marine-based sectors where retrograde bed slopes can permit runaway retreat once thresholds are crossed. In that regime, flux divergence near grounding lines can escalate nonlinearly, decoupled from surface forcing. None of this needs precise partitioning by basin to read the sign: where buttressing weakens, velocity terms dominate the budget, and the mass balance stays negative until new pinning points or colder oceans restore resistance.
Why a half-century matters
A continuous record lets scientists distinguish genuine change from measurement quirks. Over fifty years, patterns like long-term acceleration and the dynamic-versus-melt split stand out from short-term weather and seasonal noise.
The record also underpins models. Without decades of consistent measurements, it would be far harder to judge whether a slowdown is a blip or a break—and to test how much a warming ocean can speed up glacier outflow.
The bottom line
The poles’ ledger is still in the red: the ice sheets remain in net loss. Since the 1970s, that loss has added more than three centimetres to the ocean, with about four-fifths routed through faster glaciers. Today, Greenland and Antarctica together supply around a quarter of global sea-level rise.
None of those numbers are the last word—but they are long-baseline facts. They anchor the risks coastal communities face and the questions researchers must answer next.
Sources: Faster-flowing glaciers fuel decades of polar ice loss (www.esa.int)
Images: Cover: NASA/JPL; Figure 1: NASA/GSFC
How this article was made: Everyman Science uses AI tools to structure, format and optimise its articles, and occasionally to produce illustrations where no free photograph exists. The reporting these articles are based on is human-produced and cited above. Spotted an error? Write to [email protected] and we will correct it. — The editors How we work.





Science desk team of Everyman Science, curating and reporting on the day’s most significant developments in research, space exploration, and technology.