31.4 millimeters higher after 11.3 trillion tons of polar ice vanish
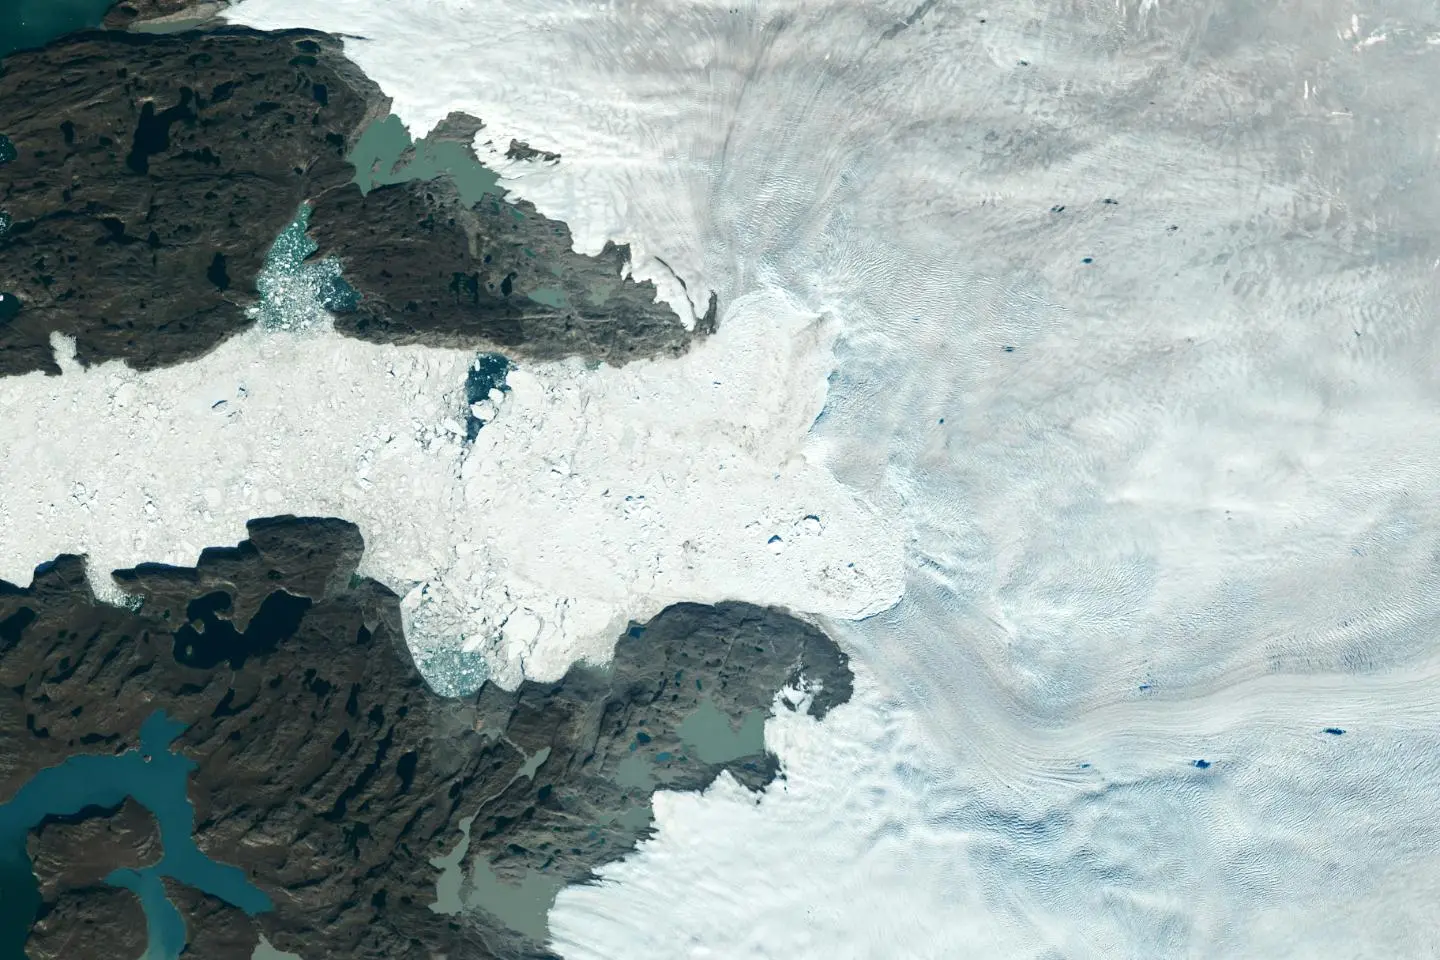
Imagine a tide gauge with a pencil mark scratched at eye level in 1979. By 2023, the ocean has crept 31.4 millimeters above that mark—about the thickness of a stack of five pennies. Satellites watching the poles over this span tally the culprit in hard units: 11,309 billion metric tons of ice drained from Greenland and Antarctica.
A longer view, reaching back to the 1970s, paints the same picture in round numbers. The longest satellite record reported via phys.org finds 11.3 trillion metric tons of polar ice gone since that decade, raising global sea level by more than 3 centimeters. The Ice Sheet Mass Balance Inter-comparison Exercise (IMBIE) Team, which combined multiple satellite surveys, provides the more precise 1979–2023 accounting above.
What’s doing the damage: speed, not melt
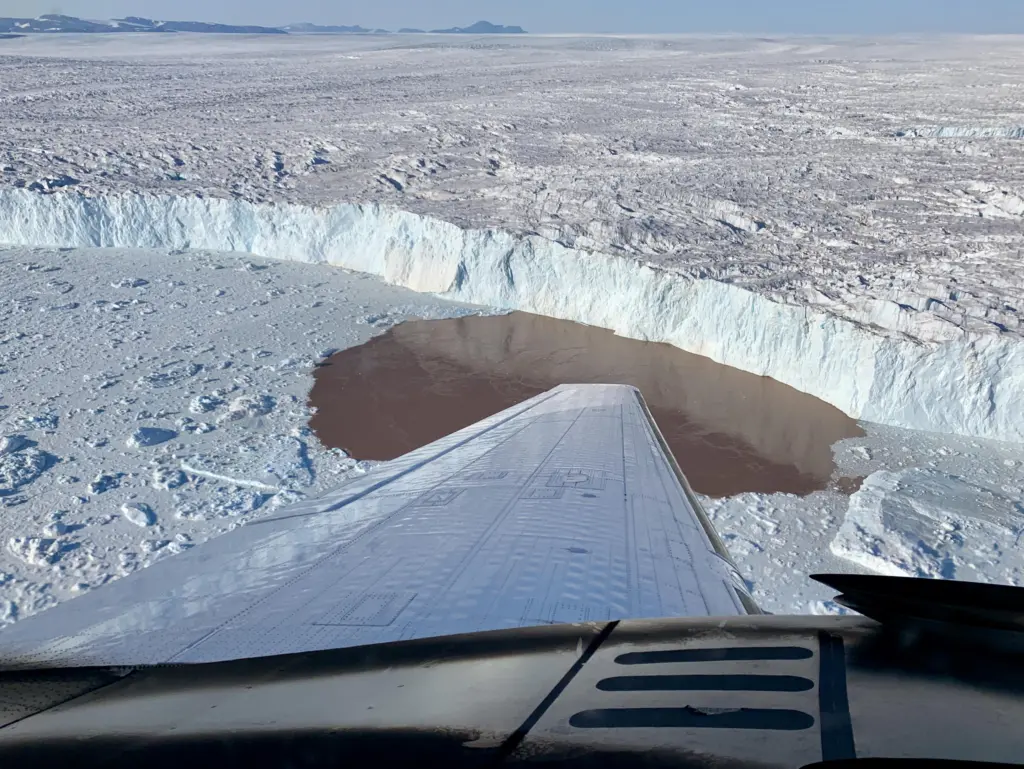
IMBIE’s breakdown is stark: 84% of the combined ice loss came from glaciers speeding up and shipping more ice into the ocean, while just 16% came from surface melting. That means the dominant driver has been the ice sheets’ own flow response rather than water pooling and melting on top.
Why that matters: flow-driven losses can continue even in cool summers, because they are tied to how quickly outlet glaciers discharge ice. Surface melt ebbs and surges with weather; faster ice flow rewrites the baseline.
How much of sea-level rise is on the ice sheets?
According to the IMBIE Team, the polar ice sheets now account for around a quarter of all global sea level rise. That share anchors them alongside thermal expansion and melting mountain glaciers as major contributors, but with a twist: the ice sheets hold far more water in reserve than the other sources.
Scale can be slippery, so here’s one human measure. Andrew Shepherd, reported via phys.org, points out that three centimeters of sea-level rise—about what the polar ice sheets have already added—puts another six to nine million people at risk of coastal flooding and erosion. Small increments stack into big consequences.
Greenland and Antarctica, by the numbers
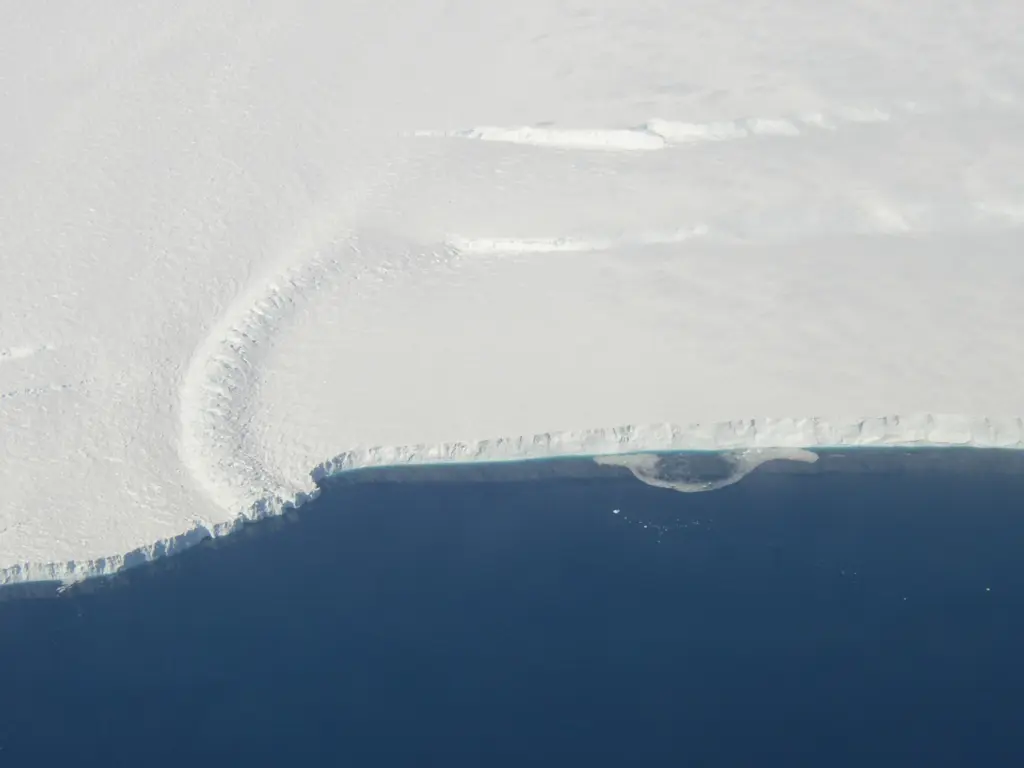
Greenland supplied the larger share of the 1979–2023 loss, while Antarctica alone raised seas by 13.3 millimeters. Both regions have shifted from modest losses in the 1980s to far steeper ones in recent decades.
Greenland’s annual loss rate rose from around 60 billion metric tons in the 1980s to 264 billion metric tons in the 2010s. Antarctica’s climbed from around 48 billion metric tons per year to 202 billion metric tons over the same period. That is not a wobble—it’s a gear change.
A breather—then what?
The most recent years in the record, 2020–2023, brought a temporary slowdown in total ice loss. IMBIE flags it as just that: temporary. Against the half-century curve, the slowdown looks like weather riding on climate.
In practical terms, a lull does not unwind the 31.4 millimeters banked in the ocean. It buys time for better coastal planning, if used—but it does not reset the baseline that accelerated through the 1990s and 2000s.
The long-range risk: tails get fatter
Sea-level projections depend heavily on how ice sheets respond. Once the risk of ice-sheet instability is included, high-end estimates of global sea level rise by 2150 increase by a factor of 2.6, the IMBIE Team reports. The uncertainty cuts both ways, but the worst-case bar rises more than twofold.
That is why a continuous, comparable record matters: it pegs models to what has actually happened, not to what seems plausible. The last half-century shows a system capable of rapid change.
What we still don’t know (and what’s beside the point)
The satellite record logs what left the ice sheets and what that added to the sea. It does not specify, year by year ahead, how much each mechanism—surface melt versus glacier speed-up—will dominate, nor does it resolve how quickly any slowdown might snap back. Those are open questions for the next updates of the record and for coastal planners who must work with moving targets.
The deeper cut
Mass balance, in the language of fluxes
Ice-sheet mass balance is the budget of a continuum: SMB − D, where SMB (surface mass balance) aggregates snowfall, sublimation, and melt–runoff at the surface, and D (dynamic discharge) is the ice volume flux across the grounding line into the ocean or across the calving front. IMBIE’s apportionment—84% of recent losses due to speed-up, 16% to surface melt—implies D has dominated the sign of SMB − D. That dominance matters because D can increase without anomalous surface energy inputs; it responds to changes in driving stress, basal sliding, and buttressing at ice shelves. In strictly kinematic terms, discharge is the depth-integrated product of velocity and thickness across an outlet’s cross-section; a modest fractional increase in velocity across many fast-flowing outlets integrates into a large basin-wide flux anomaly. By contrast, SMB perturbations can be spatially patchy and seasonally reversible. When observations report step-changes in decadal loss rates—from ~60 to 264 Gt/yr in Greenland and ~48 to 202 Gt/yr in Antarctica—they are, in effect, integrating these flux divergences over catchments and time. That is why the budget can worsen even if a summer is cool: unless D relaxes, the sign stays negative.
Why these numbers, and not others
The IMBIE Team’s accounting focuses on quantities that add up globally: mass lost (in billion metric tons), the rates that loss accelerated to (per year), and the sea-level rise those losses imply (millimeters). These are commensurate, comparable units, the currencies that matter to coasts.
Not every polar headline belongs in that ledger. Regional anecdotes tell us where to look; only basin-wide mass and sea-level sums tell us what the ocean will do. This record is built to answer that question.
Sources: Speeding glaciers drive half a century of polar ice loss (phys.org)
Images: Cover: NASA/JPL; Figure 1: NASA/JPL; Figure 2: NASA/JPL
How this article was made: Everyman Science uses AI tools to structure, format and optimise its articles, and occasionally to produce illustrations where no free photograph exists. The reporting these articles are based on is human-produced and cited above. Spotted an error? Write to [email protected] and we will correct it. — The editors How we work.





Science desk team of Everyman Science, curating and reporting on the day’s most significant developments in research, space exploration, and technology.