Saltier waters push Bay grasses to 89,385 acres
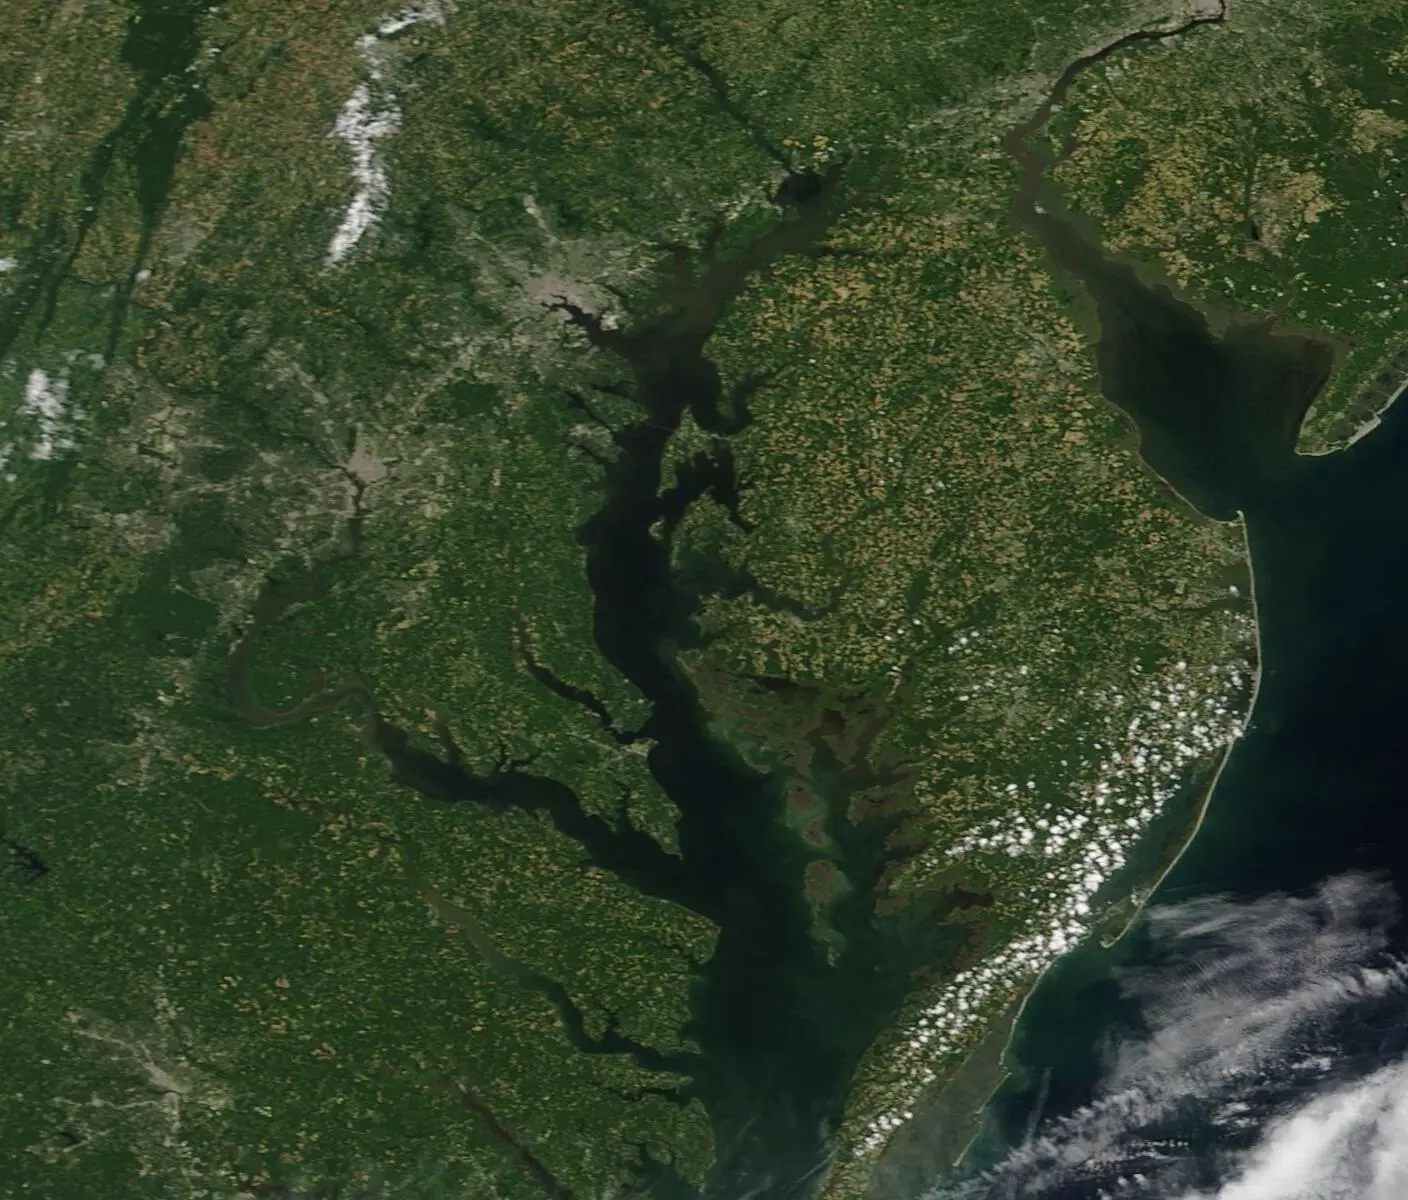
Look down from a survey plane in late summer and the Bay’s bottom tells a story in green. In 2025, submerged aquatic vegetation—those meadows of underwater grasses—spread farther across Chesapeake Bay than the year before, a 7% jump tallied in the annual aerial census.
The headline number matters: 89,385 acres. It’s the highest Baywide acreage since 2018 and, crucially, just shy of a widely watched 2030 benchmark. But the path to that figure runs through very different neighborhoods of the estuary—some surging, some slipping.
Why acreage is the scoreboard for Bay health
Submerged aquatic vegetation (SAV) is tracked because it’s one of the Bay’s most sensitive indicators of ecosystem condition. Researchers at William & Mary’s VIMS & Batten School reported a 7% increase for 2025, based on the Baywide aerial survey’s acreage total. That same survey notes the current figure is the highest since 2018 and that it sits just below the Chesapeake Bay Watershed Agreement’s 2030 interim goal of 90,000 acres.
Measured in acres rather than anecdotes, the trend also has long memory: systematic monitoring put coverage at about 39,000 acres in 1984, and researchers report it has more than doubled since then. Historical evidence says the Bay once held vastly more—between 200,000 and 600,000 acres—so today’s gains mark progress without pretending the job is done.
| Measure or zone | 2024 | 2025 | Change/Note |
|---|---|---|---|
| Baywide total | — | 89,385 acres | +6,134 acres from 2024 |
| Polyhaline (saltiest) | 25,266 acres | 28,142 acres | Increase; highest on record since 2018 Baywide total |
| Mesohaline (moderately salty) | 33,033 acres | 37,879 acres | Expanded nearly 15% |
| Tidal Fresh | 20,221 acres | 18,653 acres | Small decline |
| Oligohaline (slightly salty) | — | just over 4,700 acres | Relatively stable overall |
| 2030 interim goal | — | 90,000 acres | Baywide total is just shy |
| Long‑term goal progress | — | 196,600 acres (goal) | Approximately 45% of goal |
Salty waters led the charge; fresh waters lagged
The Bay’s saltiest reaches near its mouth—called the Polyhaline Zone—grew from 25,266 acres in 2024 to an estimated 28,142 acres in 2025. The moderately salty Mesohaline Zone expanded nearly 15%, from 33,033 to an estimated 37,879 acres. Those gains drove much of the Baywide increase.
Upstream, the picture dimmed. The Tidal Fresh Zone slipped from 20,221 acres to an estimated 18,653 acres, while the slightly salty Oligohaline Zone held relatively steady at just over 4,700 acres. The mix underscores that a single Baywide percentage hides multiple regional stories.
A comeback with a long baseline—and a long way to go
The 89,385‑acre tally puts the Bay on the doorstep of the 2030 interim target of 90,000 acres. It also represents approximately 45% of a long‑term goal of 196,600 acres. Both yardsticks keep today’s momentum in historical context: coverage hit a low around 39,000 acres in 1984 but has more than doubled since.
Compared to the past Bay of 200,000 to 600,000 acres suggested by historical evidence, today’s footprint is still modest. The 2025 survey results suggest that investments made to date continue to support recovery, even as new pressures complicate the climb toward the longer‑term goal.
The deeper cut
About that 7%: scale, baselines, and why zones matter
Percent growth can mislead when the baselines differ. The Baywide 7% increase aggregates zones that moved in opposite directions, and its meaning depends on which compartments did the moving. A “nearly 15%” expansion in mesohaline waters, for example, is acting on a base of 33,033 acres—tens of thousands of acres—so it adds materially to the total. By contrast, a “small decline” in tidal fresh waters comes off a smaller base and is partly offset by stability in slightly salty reaches. Acres are the common currency; percentages are useful only alongside the starting acreage. The table keeps both in view.
What the numbers don’t settle
The aerial survey tells us how much SAV is present and where broad salinity zones are trending. It does not, by itself, specify the exact causes behind each zone’s rise or dip in 2025, nor does it resolve how year‑to‑year weather, land use, or local conditions split the credit or blame across tributaries. Those details live in finer‑grained analyses beyond the Baywide snapshot.
Why this is a fair comparison—and where it’s apples to oranges
All the rows in the table come from the same annual Baywide aerial survey, which makes comparing 2024 and 2025 coverage within each zone reasonable. Baywide totals and goals also sit on the same scale: acres. Where caution is required is across zones. A “nearly 15%” mesohaline increase can add more acreage than a “small decline” in tidal fresh, simply because the starting numbers differ.
Historical comparisons are also two‑edged. They are essential for context—coverage has more than doubled since 1984—yet the wide historical range of 200,000 to 600,000 acres reminds us that “the past” is not a single target. That breadth reflects the Bay’s variability and keeps today’s 45%‑of‑goal figure in perspective.
What would it take to move the needle again?
The Baywide total rose by 6,134 acres from 2024—enough to mark the highest acreage since 2018 and edge toward the 2030 interim goal. Researchers say the 2025 results suggest past investments continue to support recovery, and that’s the standard to judge the next round of management against.
Crossing from “just shy” of one target to sustained progress toward 196,600 acres will mean repeating the kind of net gains seen in the saltier zones while avoiding losses upstream. The complexity is the point: Baywide trends are built from local trajectories, zone by zone.
Sources: Chesapeake Bay underwater grasses increase 7%, buoyed by gains in salty waters (phys.org)
Images: Cover: MODIS Land Rapid Response Team, NASA GSFC / Wikimedia Commons
How this article was made: Everyman Science uses AI tools to structure, format and optimise its articles, and occasionally to produce illustrations where no free photograph exists. The reporting these articles are based on is human-produced and cited above. Spotted an error? Write to [email protected] and we will correct it. — The editors How we work.





Science desk team of Everyman Science, curating and reporting on the day’s most significant developments in research, space exploration, and technology.