When a Manhattan-sized slab breaks off Greenland
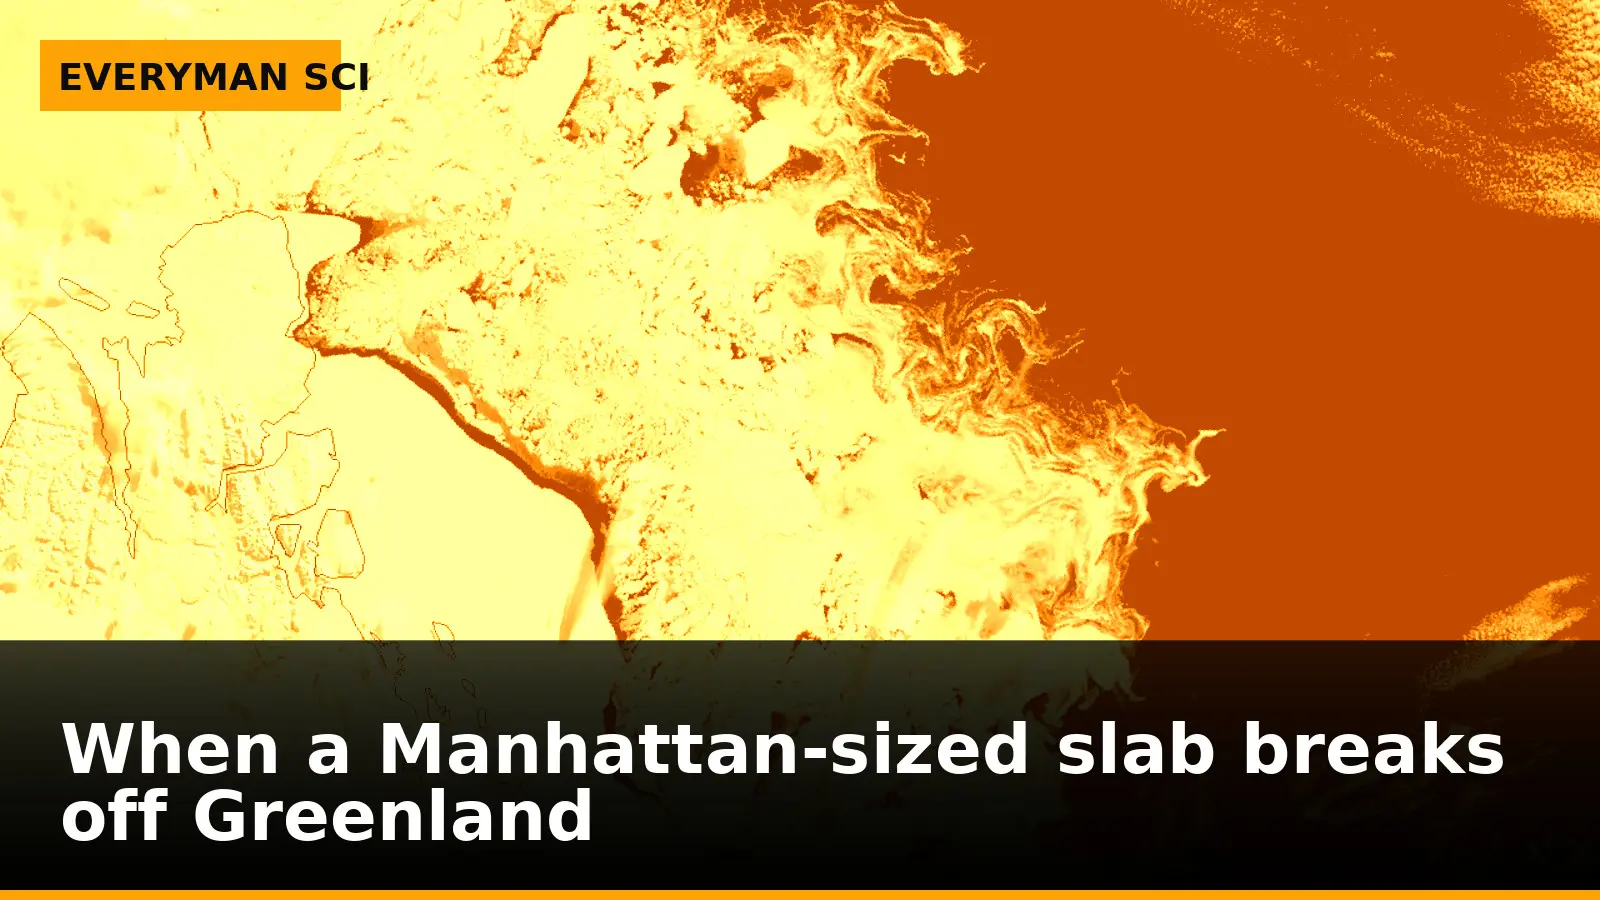
On a grey Arctic morning, a slab of ice about the size of Manhattan and as thick as a 40‑storey building cracked free from Greenland. On 4 August 2026, Petermann Glacier in the island’s far northwest shed a 76 square kilometre tabular iceberg—an ice island—that Europe’s Sentinel‑1 satellites watched detach in near real time.
For Petermann, it’s the biggest loss of floating ice since 2012, and the Arctic’s most significant calving since 2020. The striking part isn’t only the size. It’s how quickly the final act unfolded—and how clearly satellites had been showing the build‑up for months.
Why this is in the headlines now
A day before the break, radar images from Sentinel‑1 showed the ice tongue’s centreline deteriorating. By the next day, the vast ice island had drifted free from the glacier’s eastern side. The European Space Agency (ESA) flagged the event on 21 August after researchers poring over those images confirmed what they had been anticipating: a long‑watched set of fractures had finally linked up across the floating tongue.
The news peg is a clean one—a big, trackable iceberg is now at sea—but the real story is the mechanism. A team funded in part by ESA’s FutureEO ARCTEX project has been monitoring Petermann since 2019, documenting cracks that deepened and spread until separation was inevitable.
From ice tongue to ice island
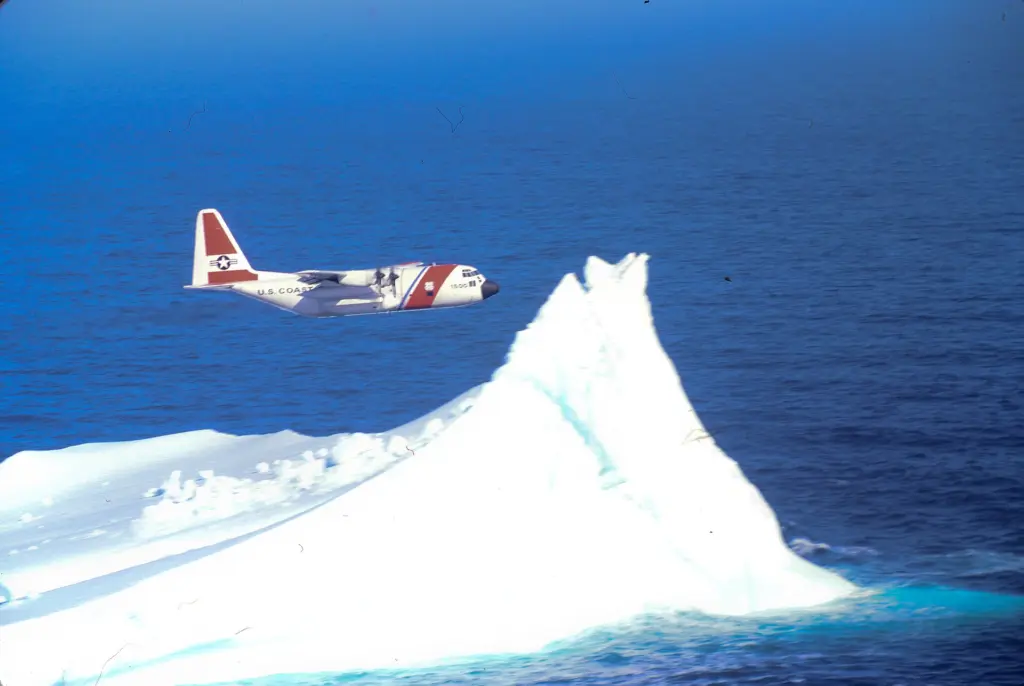
Petermann is known for its long floating ice tongue—a shelf of glacier ice that juts out over the ocean. When a slab splits off and sails away intact, scientists call it a tabular iceberg, or in the Arctic context, an ice island. The new island is estimated to be up to 150 metres thick, the kind of big‑flat‑top geometry more often seen in the Southern Ocean than in the Arctic.
That contrast matters. As Anna Crawford of the University of Stirling points out, large tabular icebergs are relatively common around Antarctica but are far rarer in the Arctic. The analogy that springs to mind is a slow‑moving factory belt shedding pallets; the resemblance ends there, because an ice tongue’s “production rate” depends on evolving rifts, ocean tides and stresses frozen into the ice—factors that don’t tick along at a steady pace.
Calving doesn’t come out of nowhere
Petermann has a documented history of dramatic calving—major ice islands formed in 2008, 2010 and 2012—followed by a relatively stable decade punctuated by smaller breaks. The latest event wasn’t a surprise to those watching. Interferometric observations in April revealed deformation and fractures within the ice tongue months before the August detachment.
By early August, Sentinel‑1 imagery showed pronounced deterioration along the tongue’s centreline. Cracks propagate until they connect; once they do, the slab is only “attached” by friction and small bridges of ice. As University of Ottawa PhD student Adam Garbo put it, researchers had anticipated this break for years, and its arrival underscores how quickly these systems can change once conditions line up.
Seeing through cloud and dark: why radar matters
Greenland’s weather and polar night are not kind to optical satellites. Sentinel‑1 carries a radar, so it can observe day and night and through cloud cover. That reliability is why the mission is so well‑suited to monitoring remote Arctic glaciers, where the moment a crack links up can easily be lost to fog or darkness.
The Petermann campaign leaned on exactly that strength. Using Sentinel‑1 radar imagery, an international team from the University of Ottawa; the Universities of Stirling, Lancaster and Leeds; and the Canadian Ice Service has tracked the glacier since 2019. The long run of consistent, weather‑proof observations is what turns snapshots into a story of how fractures grow and stability erodes.
A brief window that made the difference
In the weeks before the break, Sentinel‑1 offered something unusually powerful: one‑day repeat synthetic aperture radar coverage during a tandem phase of the newly launched Sentinel‑1D with Sentinel‑1C. That cadence produced detailed interferograms—maps of surface change—showing where fractures were growing and how the floating tongue rose and fell with ocean tides.
Molly Hammond, a PhD student at the University of Leeds who processed the data, described watching the crack propagation in near real time as “incredibly exciting,” and a clear demonstration of the value of one‑day repeat synthetic aperture data. ESA’s Martin Wearing noted that the rarity of such large tabular icebergs in the Arctic makes this a unique chance to follow how a vast ice mass drifts, evolves and eventually breaks apart.
What happens to the ice now
Large ice masses can linger in the ocean for years, slowly breaking into smaller fragments. That’s a scientific opportunity and a practical headache. Environment and Climate Change Canada is tracking the iceberg’s trajectory and assessing risks to shipping routes and offshore infrastructure, because smaller pieces are harder to detect and monitor.
The team will continue to watch both the glacier and the iceberg using satellite imagery, aerial observations and tracking data. The point is not just to plot a course on a map. Following the movement and fragmentation over time offers clues about how calved ice interacts with currents and tides and how the parent glacier responds as its floating brace is reshaped.
Why the next breaks may come sooner
The 4 August iceberg is unlikely to be the last big change at Petermann in the near term. Two further large ice islands—estimated at about 97 and 87 square kilometres—could detach as existing rifts keep propagating across the floating tongue. The same surveillance network that caught this calving will be watching those cracks link up, or stall.
That forward look is part of the scientific value here: Arctic ice islands are uncommon, so each one is a rare test case. By studying how they calve and deteriorate, researchers aim to transfer lessons across polar regions about impacts on glacier dynamics, sea‑level rise and the ocean environment.
The deeper cut
What one‑day repeat interferometry added at Petermann
Interferometric observations of Petermann acquired in April revealed deformation and fractures within the ice tongue months before the calving. During the commissioning of Sentinel‑1D, its tandem phase with Sentinel‑1C delivered one‑day repeat synthetic aperture radar images and, with them, very detailed interferograms. Those products pinpointed the location and growth of fractures and captured the ice tongue’s surface motion with ocean tides in the lead‑up to the break.
That cadence mattered. The changes in the days before 4 August were occurring very rapidly, and the near‑real‑time view let researchers monitor crack propagation as it happened. The combination—radar’s all‑weather, day‑night coverage and a one‑day repeat cycle—demonstrated the specific value of synthetic aperture data at this timescale for diagnosing instability on a floating ice tongue. It is exactly the kind of systematic, long‑term observation Sentinel‑1 was built to provide, and in this case, it turned a dramatic event into a well‑documented sequence of steps.
What failure looks like in this system
Calving is failure in slow motion, accelerated at the end. The warning signs at Petermann—fractures mapped months in advance, pronounced deterioration along the centreline by 3 August—show how a floating tongue can hold, then suddenly give way once rifts connect. If monitoring stopped at yearly or even monthly snapshots, that final sprint would look like a surprise rather than the last pages of a long chapter.
There’s a practical corollary offshore. The big tabular slab that splits cleanly is easy to spot and avoid. The trouble arrives over the following seasons, when it breaks into ever smaller pieces that are increasingly difficult to detect and track—just as Canada’s ice service warns. Those fragments are also the ones most likely to stray into shipping routes and oil and gas infrastructure zones.
A rare Arctic case study, watched end to end
In the Southern Ocean, shelves shedding large flat‑topped icebergs is business as usual; in the Arctic, it’s not. That rarity makes Petermann 2026 an outsized learning moment. ESA’s team emphasises that following how this ice island drifts, evolves and eventually breaks apart will feed back into understanding the processes that set calving thresholds and reshape the wider polar environment.
It helps that the watch began long before the crack ran across the tongue. Since 2019, the same mix of institutions has been building a record at Petermann, documenting the gradual growth of fractures and the increasing signs of instability. When the slab finally let go, it did so under a set of eyes ready to see the details.
| Year | Event detail |
|---|---|
| 2008 | Formation of a large ice island |
| 2010 | Formation of a large ice island |
| 2012 | Formation of a large ice island; largest loss of floating ice before 2026 |
| 2019–2026 | Continuous monitoring with Sentinel‑1 radar imagery |
| April 2026 | Interferometric observations reveal deformation and fractures |
| 3 Aug 2026 | Pronounced deterioration along ice tongue centreline in Sentinel‑1 imagery |
| 4 Aug 2026 | Detachment of a 76 km², up to 150 m thick tabular iceberg |
| Future | Two further ice islands (~97 km² and ~87 km²) could detach as rifts propagate |
What we learn by keeping watch
The point of tracking a single ice island is not the spectacle; it’s the mechanism. Sentinel‑1’s systematic coverage—day, night, and through cloud—turns the Arctic’s remoteness from a barrier into a dataset. As ESA puts it, that is how you get from a dramatic news image to a better grasp of the processes driving calving and their wider impacts.
The Petermann team will keep following both the glacier and the iceberg with satellites, aircraft and trackers. The next time a rift knits across the tongue, it’s likely that someone will see it happen—not by luck, but because the eyes are already on.
Sources: Sentinel-1 captures major ice loss from Greenland glacier (www.esa.int)
Images: Cover: Everyman Science (illustration); Figure 1: U.S. Coast Guard photo by Petty Officer 1st Class Brandon Brewer / Wikimedia Commons
How this article was made: Everyman Science uses AI tools to structure, format and optimise its articles, and occasionally to produce illustrations where no free photograph exists. The reporting these articles are based on is human-produced and cited above. Spotted an error? Write to [email protected] and we will correct it. — The editors How we work.





Science desk team of Everyman Science, curating and reporting on the day’s most significant developments in research, space exploration, and technology.